Report of the Medical Officer of Health / Municipality of Colombo.
- Colombo (Sri Lanka). Public Health Department
- Date:
- [1910]
Licence: Public Domain Mark
Credit: Report of the Medical Officer of Health / Municipality of Colombo. Source: Wellcome Collection.
6/46 page 44
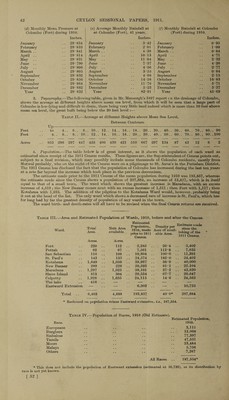
![The death rate by years, races, and wards are shown in the following Tables :— Table VIII.—Colombo and Ceylon Death-rates, 1900-1910. Death-rate per 1,000 Population. Year. Colombo. Ceylon 1900 • • 33-8 27-8 1901 • • ■ • 34-7 27-6 1902 • • • • 33-5 27-5 1903 34-8 25-9 1904 30-8 24-9 1905 • • • • 34-7 27-7 1906 39-8 34-3 1907 • • • • 32-6 30-1 190S • • • • 36-7 29-4 1909 .. 33; 5 30-3 Average, 1900-1909 34-5 28-6 1910 (Old estimate of population) 29-7 1910 (New estimate of population) 28-8 1910 Corrected for non-residents dying in insti- tutions .. • • • • 23 0 1910 Corrected for non-residents and for age and sex 25-7* * This is the most correct death-rate. Table IX.—Racial Death-rates (all Causes). « Death-rate per 1,000 Population. Increase or 1900-1909. 1910. Decrease. Europeans 29-1 25*1 — 4-0 Burghers 26-4 24-3 — 21 Sinhalese 374 35-4 — 2-0 Tamils 34-5 28-1 — 6-4 Moors 31-8 28-9 — 2-9 Malays 35-0 28-1 — 6-9 Others 31-6 211 —10-5 All Races .. 34‘5 29-7* — 4-8 * Reckoned on population inclusive of Eastward extension. Table X.—Ward Death-rates (all Causes). Ward. Death-rate per 1,000 Population. Increase or 1900-1909. 1910. Decrease. Fort and Galle Face .. 14-0 17-1 -f 31 Pettah 139 12-4 — 1-5 San Sebastian 24-7 23 3 — 1*4 St. Paul’s 251 227 — 24 Ivotahena 27-1 22 3 — 4-8 New Bazaar 30-3 24-5 — 5-8 Maradana 26-7 23-9 — 2-8 Slave Island 28-7 23-0 — 5-7 Kollupitiya 193 18-5 — 0-8 Colombo Town 34 5 29’7* _ 4-8 * Reckoned on population inclusive of Eastward extension. 7. Infant Mortality: (a) General.—Deaths, 1,420; death rate, 295 per 1,000 births; average death- rate during the previous ten years, 353 ; decrease, 58 per 1,000 births. One of the most satisfactory features of the mortality statistics in Colombo is the infant death-rate which has been more or less steadily falling for a series of years, the rate in 1910 being the lowest on record. A glance at the accompanying diagram shows the period during which this improvement has been manifested, viz., from 1903 up to date. The horizontal line in the diagram represents the mean infant death-rate for the whole period 1897 to 1910, the black columns above the lines represent the percentage above the mean death-rate, while the shaded columns represent the percentage below the mean. . It is of course difficult to say definitely what are all the factors responsible for this decrease in the number of infant deaths, but the following are probably the chief, viz.: (1) meteorological conditions ; (2) improved methods of town cleansing; (3) improved housing conditions ; (4) the work of the Municipal midwives. With regard to the meteorological conditions, one cannot but be struck by the fact shown on the two accompanying diagrams, that the period of low infant mortality synchronizes to a large extent with a period of shortage of rainfall, although it does not apparently necessarily follow (as the exceptions show) that a dry year means a low infant death-rate, and a wet year a high rate, [ 54 ]](https://iiif.wellcomecollection.org/image/b3175336x_0006.jp2/full/800%2C/0/default.jpg)